Backtesting
Online Link
The following code shows how to use FinMind to perform strategy backtesting. The backtest is mainly driven by strategies, while DataLoader reads the data provided by FinMind.
When running a backtest, you mainly need to first decide the backtest target, the backtest period, the funding amount, the trading tax, and the design of the strategy.
The backtest logic is mainly to determine the entry, hold, and exit signals. For example:
- If today's calculated signal is -1, it means tomorrow 1 lot of stock will be **sold** at the opening price
- If today's calculated signal is 0, it means do nothing tomorrow
- If today's calculated signal is 1, it means tomorrow 1 lot of stock will be **bought** at the opening price
The backtest result provides the following information:
- trade_detail: Detailed backtest data
- compare_market_detail: Trends of cumulative market return and cumulative backtest return
- final_stats: Backtest result
- compare_market_stats: Annualized return of the market and annualized return of the strategy
In the example program, it is mainly divided into using the strategies provided by FinMind and customized strategies.
Initialization: set backtest stock id and time period
import numpy as np
import pandas as pd
from FinMind import strategies
from FinMind.data import DataLoader
from FinMind.strategies.base import Strategy
from ta.momentum import StochasticOscillator


data_loader = DataLoader()
# data_loader.login_by_token(api_token='token') # optional
obj = strategies.BackTest(
     stock_id="0056",
     start_date="2018-01-01",
     end_date="2019-01-01",
     trader_fund=500000.0,
     fee=0.001425,
     data_loader=data_loader,
)
obj.stock_price
The backtest will be calculated using the following data
          date stock_id  Trading_Volume  Trading_money   open    max    min  close  spread  Trading_turnover  CashEarningsDistribution  StockEarningsDistribution
0    2018-01-02     0056         1868451       46856990  25.00  25.14  25.00  25.13    0.13             733.0                       0.0                        0.0
1    2018-01-03     0056         3846820       97179269  25.15  25.31  25.15  25.31    0.18            1202.0                       0.0                        0.0
2    2018-01-04     0056         2736229       69496928  25.31  25.45  25.31  25.41    0.10             957.0                       0.0                        0.0
3    2018-01-05     0056         2383585       60620826  25.41  25.48  25.39  25.44    0.03             782.0                       0.0                        0.0
4    2018-01-08     0056         3048596       77817525  25.45  25.57  25.45  25.57    0.13            1236.0                       0.0                        0.0
..          ...      ...             ...            ...    ...    ...    ...    ...     ...               ...                       ...                        ...
242  2018-12-24     0056         1501284       36271556  24.20  24.21  24.09  24.18    0.01             773.0                       0.0                        0.0
243  2018-12-25     0056        13908880      332473777  24.01  24.06  23.84  23.97   -0.21            6359.0                       0.0                        0.0
244  2018-12-26     0056        12600245      300239138  24.09  24.09  23.67  23.72   -0.25            6413.0                       0.0                        0.0
245  2018-12-27     0056         2986526       71566004  24.00  24.02  23.90  23.91    0.19            1651.0                       0.0                        0.0
246  2018-12-28     0056         2657586       63571334  23.93  23.96  23.89  23.94    0.03            1075.0                       0.0                        0.0
Design Strategy
class Kd(Strategy):
     """
     summary:
          Daily KD 80 20
          Daily K-line <= 20 enter
          Daily K-line >= 80 exit
     """
     kdays = 9
     kd_upper = 80
     kd_lower = 20
     def create_trade_sign(self, stock_price: pd.DataFrame) -> pd.DataFrame:
          stock_price = stock_price.sort_values("date")
          kd = StochasticOscillator(
               high=stock_price["max"],
               low=stock_price["min"],
               close=stock_price["close"],
               n=self.kdays,
          )
          rsv_ = kd.stoch().fillna(50)
          _k = np.zeros(stock_price.shape[0])
          _d = np.zeros(stock_price.shape[0])
          for i, r in enumerate(rsv_):
               if i == 0:
                    _k[i] = 50
                    _d[i] = 50
               else:
                    _k[i] = _k[i - 1] * 2 / 3 + r / 3
                    _d[i] = _d[i - 1] * 2 / 3 + _k[i] / 3
          stock_price["K"] = _k
          stock_price["D"] = _d
          stock_price.index = range(len(stock_price))
          stock_price["signal"] = 0
          stock_price.loc[stock_price["K"] <= self.kd_lower, "signal"] = 1
          stock_price.loc[stock_price["K"] >= self.kd_upper, "signal"] = -1
          return stock_price
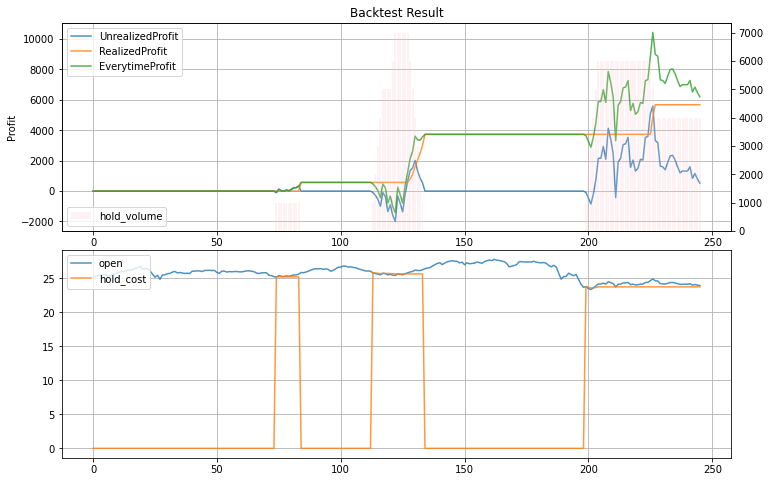
output
output
stock_id        date  EverytimeProfit  RealizedProfit  UnrealizedProfit  board_lot  hold_cost  hold_volume  signal    tax       fee  trade_price   trader_fund
0       0056  2018-01-03             0.00            0.00              0.00       1000   0.000000            0       0  0.001  0.001425        25.15  500000.00000
1       0056  2018-01-04             0.00            0.00              0.00       1000   0.000000            0       0  0.001  0.001425        25.31  500000.00000
2       0056  2018-01-05             0.00            0.00              0.00       1000   0.000000            0       0  0.001  0.001425        25.41  500000.00000
3       0056  2018-01-08             0.00            0.00              0.00       1000   0.000000            0       0  0.001  0.001425        25.45  500000.00000
4       0056  2018-01-09             0.00            0.00              0.00       1000   0.000000            0       0  0.001  0.001425        25.55  500000.00000
..       ...         ...              ...             ...               ...        ...        ...          ...     ...    ...       ...          ...           ...
241     0056  2018-12-24          7274.35         5677.56           1596.79       1000  23.742118         4000       0  0.001  0.001425        24.20  410709.09425
242     0056  2018-12-25          6516.19         5677.56            838.63       1000  23.742118         4000       0  0.001  0.001425        24.01  410709.09425
243     0056  2018-12-26          6835.42         5677.56           1157.86       1000  23.742118         4000       0  0.001  0.001425        24.09  410709.09425
244     0056  2018-12-27          6476.29         5677.56            798.73       1000  23.742118         4000       0  0.001  0.001425        24.00  410709.09425
245     0056  2018-12-28          6196.97         5677.56            519.41       1000  23.742118         4000       0  0.001  0.001425        23.93  410709.09425