回測(引用外部 data)
線上連結
初始化,設定回測股票代碼、時間區間
import numpy as np
import pandas as pd
from FinMind import strategies
from FinMind.data import DataLoader
from FinMind.strategies.base import Strategy
from ta.momentum import StochasticOscillator

data_loader = DataLoader()
# data_loader.login_by_token(api_token='token') # 可選
obj = strategies.BackTest(
    stock_id="0056",
    start_date="2018-01-01",
    end_date="2019-01-01",
    trader_fund=500000.0,
    fee=0.001425,
    data_loader=data_loader,
)
obj.stock_price
將會用以下 data 計算回測
        date stock_id  Trading_Volume  Trading_money   open    max    min  close  spread  Trading_turnover  CashEarningsDistribution  StockEarningsDistribution
0    2018-01-02     2330        18055269     4188555408  231.5  232.5  231.0  232.5     3.0            9954.0                       0.0                        0.0
1    2018-01-03     2330        31706091     7504382512  236.0  238.0  235.5  237.0     4.5           13633.0                       0.0                        0.0
2    2018-01-04     2330        29179613     6963192636  240.0  240.0  236.5  239.5     2.5           10953.0                       0.0                        0.0
3    2018-01-05     2330        23721255     5681934695  240.0  240.0  238.0  240.0     0.5            8659.0                       0.0                        0.0
4    2018-01-08     2330        21846692     5281823362  242.0  242.5  240.5  242.0     2.0           10251.0                       0.0                        0.0
..          ...      ...             ...            ...    ...    ...    ...    ...     ...               ...                       ...                        ...
729  2020-12-25     2330        12581145     6449612552  514.0  515.0  510.0  511.0     1.0           14988.0                       0.0                        0.0
730  2020-12-28     2330        19262886     9890545245  512.0  515.0  509.0  515.0     4.0           16673.0                       0.0                        0.0
731  2020-12-29     2330        20151736    10370562545  515.0  517.0  513.0  515.0     0.0           17186.0                       0.0                        0.0
732  2020-12-30     2330        46705107    24306881615  516.0  525.0  514.0  525.0    10.0           33173.0                       0.0                        0.0
733  2020-12-31     2330        30326332    15989936054  526.0  530.0  524.0  530.0     5.0           25134.0                       0.0                        0.0
設計策略
class ShortSaleMarginPurchaseRatio(Strategy):
    """
    summary:
        策略概念: 券資比越高代表散戶看空,法人買超股票會上漲,這時候賣可以跟大部分散戶進行相反的操作,反之亦然
        策略規則: 券資比>=30% 且法人買超股票, 賣
                券資比<30% 且法人賣超股票 買
    """

    ShortSaleMarginPurchaseTodayRatioThreshold = 0.3

    def load_taiwan_stock_margin_purchase_short_sale(self):
        self.TaiwanStockMarginPurchaseShortSale = (
            self.data_loader.taiwan_stock_margin_purchase_short_sale(
                stock_id=self.stock_id,
                start_date=self.start_date,
                end_date=self.end_date,
            )
        )
        self.TaiwanStockMarginPurchaseShortSale[
            ["ShortSaleTodayBalance", "MarginPurchaseTodayBalance"]
        ] = self.TaiwanStockMarginPurchaseShortSale[
            ["ShortSaleTodayBalance", "MarginPurchaseTodayBalance"]
        ].astype(
            int
        )
        self.TaiwanStockMarginPurchaseShortSale[
            "ShortSaleMarginPurchaseTodayRatio"
        ] = (
            self.TaiwanStockMarginPurchaseShortSale["ShortSaleTodayBalance"]
            / self.TaiwanStockMarginPurchaseShortSale[
                "MarginPurchaseTodayBalance"
            ]
        )

    def load_institutional_investors_buy_sell(self):
        self.InstitutionalInvestorsBuySell = (
            self.data_loader.taiwan_stock_institutional_investors(
                stock_id=self.stock_id,
                start_date=self.start_date,
                end_date=self.end_date,
            )
        )
        self.InstitutionalInvestorsBuySell[["sell", "buy"]] = (
            self.InstitutionalInvestorsBuySell[["sell", "buy"]]
            .fillna(0)
            .astype(int)
        )
        self.InstitutionalInvestorsBuySell = (
            self.InstitutionalInvestorsBuySell.groupby(
                ["date", "stock_id"], as_index=False
            ).agg({"buy": np.sum, "sell": np.sum})
        )
        self.InstitutionalInvestorsBuySell["diff"] = (
            self.InstitutionalInvestorsBuySell["buy"]
            - self.InstitutionalInvestorsBuySell["sell"]
        )

    def create_trade_sign(self, stock_price: pd.DataFrame) -> pd.DataFrame:
        stock_price = stock_price.sort_values("date")
        self.load_taiwan_stock_margin_purchase_short_sale()
        self.load_institutional_investors_buy_sell()
        stock_price = pd.merge(
            stock_price,
            self.InstitutionalInvestorsBuySell[["stock_id", "date", "diff"]],
            on=["stock_id", "date"],
            how="left",
        ).fillna(0)
        stock_price = pd.merge(
            stock_price,
            self.TaiwanStockMarginPurchaseShortSale[
                ["stock_id", "date", "ShortSaleMarginPurchaseTodayRatio"]
            ],
            on=["stock_id", "date"],
            how="left",
        ).fillna(0)
        stock_price.index = range(len(stock_price))
        stock_price["signal"] = 0
        sell_mask = (
            stock_price["ShortSaleMarginPurchaseTodayRatio"]
            >= self.ShortSaleMarginPurchaseTodayRatioThreshold
        ) & (stock_price["diff"] > 0)
        stock_price.loc[sell_mask, "signal"] = -1
        buy_mask = (
            stock_price["ShortSaleMarginPurchaseTodayRatio"]
            < self.ShortSaleMarginPurchaseTodayRatioThreshold
        ) & (stock_price["diff"] < 0)
        stock_price.loc[buy_mask, "signal"] = 1
        return stock_price
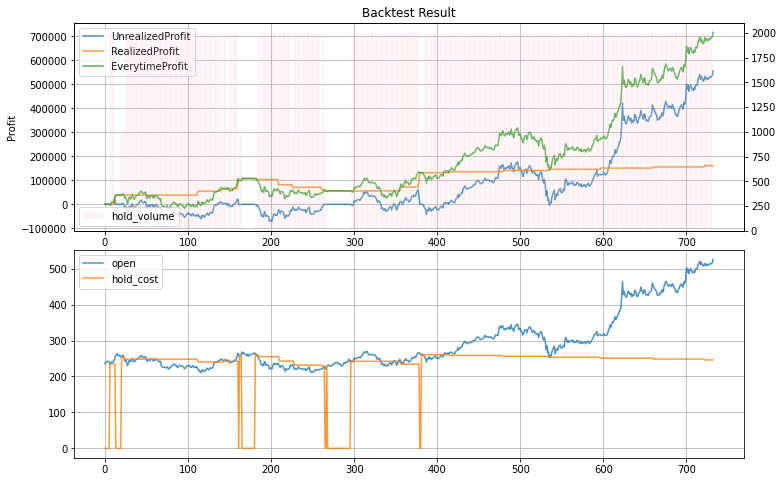
output
output
    stock_id        date  EverytimeProfit  RealizedProfit  UnrealizedProfit  board_lot  hold_cost  hold_volume  signal    tax       fee  trade_price  trader_fund
0       2330  2018-01-03             0.00            0.00              0.00       1000     0.0000            0       0  0.003  0.001425        236.0   500000.000
1       2330  2018-01-04             0.00            0.00              0.00       1000     0.0000            0       0  0.003  0.001425        240.0   500000.000
2       2330  2018-01-05             0.00            0.00              0.00       1000     0.0000            0       0  0.003  0.001425        240.0   500000.000
3       2330  2018-01-08             0.00            0.00              0.00       1000     0.0000            0      -1  0.003  0.001425        242.0   500000.000
4       2330  2018-01-09             0.00            0.00              0.00       1000     0.0000            0      -1  0.003  0.001425        242.0   500000.000
..       ...         ...              ...             ...               ...        ...        ...          ...     ...    ...       ...          ...          ...
728     2330  2020-12-25        692703.01       160992.91         531710.10       1000   245.8705         2000       0  0.003  0.001425        514.0    47251.925
729     2330  2020-12-28        688720.71       160992.91         527727.80       1000   245.8705         2000       0  0.003  0.001425        512.0    47251.925
730     2330  2020-12-29        694694.16       160992.91         533701.25       1000   245.8705         2000       0  0.003  0.001425        515.0    47251.925
731     2330  2020-12-30        696685.31       160992.91         535692.40       1000   245.8705         2000       0  0.003  0.001425        516.0    47251.925
732     2330  2020-12-31        716596.81       160992.91         555603.90       1000   245.8705         2000       0  0.003  0.001425        526.0    47251.925